update at the end of the post!
There obviously is one – after all, logging information has to be more expensive than not logging it. But how big is it? And more importantly, what is the difference between logging to stderr/file, csvlog and syslog? And what about syslog to remote machine?
Let's see.
For my test, I used 2 machines:
- DB server:
- 12GB Ram
- i7 920 CPU (4 cores + HT, 2.67GHz)
- two disks (WDC VelociRaptor 300GB), with LVM
- dedicated place for logs – on SSD – old Intel X25M SSD
- Linux (kernel 3.8.0 with Kubuntu distribution)
- Log server:
- 3.5GB RAM
- Core 2 Quad Q8200 CPU (4 cores, 2.33GHz)
- 7 Seagate Barracuda 7200.11, 1.5TB disks in software Raid 5
- Linux (kernel 3.10 with Debian testign distribution)
This is not much, but I don't want to look at the absolute numbers – instead I want to see some percentages.
For my tests, I will use PostgreSQL 9.2.4.
Baseline will be established using following setup:
$ select name, setting from pg_settings  where name ~ '^log';
            name             |            setting
-----------------------------+--------------------------------
 log_autovacuum_min_duration | 0
 log_checkpoints             | off
 log_connections             | off
 log_destination             | stderr
 log_directory               | /var/tmp
 log_disconnections          | off
 log_duration                | off
 log_error_verbosity         | default
 log_executor_stats          | off
 log_file_mode               | 0600
 log_filename                | postgresql-%Y-%m-%d_%H%M%S.log
 log_hostname                | off
 log_line_prefix             | %m %u@%d %p %r
 log_lock_waits              | on
 log_min_duration_statement  | -1
 log_min_error_statement     | error
 log_min_messages            | warning
 log_parser_stats            | off
 log_planner_stats           | off
 log_rotation_age            | 1440
 log_rotation_size           | 102400
 log_statement               | none
 log_statement_stats         | off
 log_temp_files              | 0
 log_timezone                | Poland
 log_truncate_on_rotation    | off
 logging_collector           | on
(27 rows)
/var/tmp is on the ssd. Logs are minimal.
To initialize the test database, I used:
=$ pgbench -s 2000 -i
Which created test database that is 29GB.
So, to test how it performs, I ran 3 tests:
- 5 minutes with 1 worker thread
- 5 minutes with 4 worker threads
- 5 minutes with 8 worker threads
In all of the cases, I used select-only tests. So the command to test looked like:
=$ pgbench -c 1 -j 1 -r -S -T 300 -n
For higher count of threads, I modified both -c and -j, to the same value.
Each test was run 3 times, and I picked the best result.
Results, without query logging:
- 1 worker: 142.911064 tps (latency: 6.988215 ms)
- 4 workers: 146.989056 tps (latency: 27.203221 ms)
- 8 workers: 159.615062 tps (latency: 50.108551 ms)
OK. Whether the numbers are good or bad doesn't matter – it's the baseline. So, let's turn on all-query logging, with:
log_min_duration_statement = 0
And redo the test.
Results with query logged to stderr, which gets written to file on ssd:
- 1 worker: 140.810524 tps (latency: 7.092938 ms)
- 4 workers: 152.439878 tps (latency: 26.229825 ms)
- 8 workers: 164.182018 tps (latency: 48.714168 ms)
OK. Apparently testing got faster with logging, at least with 4 and 8 workers, but let's just assume this is measurement error. Now for the real fun. First comparison test – CSVLOG.
Change is:
log_destination = 'csvlog'
Results:
- 1 worker: 146.199242 tps (latency: 6.831225 ms)
- 4 workers: 158.566863 tps (latency: 25.216751 ms)
- 8 workers: 166.116313 tps (latency: 48.146276 ms)
Nothing really fancy in here. So let's see syslog. This will require a bit more changes.
First, in postgresql.conf:
log_destination = 'syslog'
log_line_prefix = '%u@%d %r '
Changed log_line_prefix as syslog already does provide pid and timestamp.
Then, in /etc/rsyslog.d/50-default.conf I made this change:
--- 50-default.conf.backup      2013-09-05 15:02:25.912460578 +0200
+++ 50-default.conf     2013-09-05 15:02:50.908363525 +0200
@@ -5,8 +5,9 @@
 #
 # First some standard log files.  Log by facility.
 #
+local0.*        /var/tmp/postgres.log
 auth,authpriv.*                        /var/log/auth.log
-*.*;auth,authpriv.none         -/var/log/syslog
+*.*;local0,auth,authpriv.none          -/var/log/syslog
 #cron.*                                /var/log/cron.log
 #daemon.*                      -/var/log/daemon.log
 kern.*                         -/var/log/kern.log
Additionally, I commented out a line in /etc/rsyslog.conf:
# $ActionFileDefaultTemplate RSYSLOG_TraditionalFileFormat
Thanks to this syslog will use sensible, high-precision, timestamping. Default timestamps have just 1 second precision, and no year information so they are not really useful for log analysis.
After all the changes, pg logs get to /var/tmp/postgres.log and look like this:
2013-09-05T15:12:39.968627+02:00 h3po4 postgres[2259]: [2-1] depesz@depesz [local] LOG: duration: 16.779 ms statement: select 123;
With logging set, and another 45 minutes of tests, I got these results:
- 1 worker: 149.323508 tps (latency: 6.688188 ms)
- 4 workers: 159.188091 tps (latency: 25.117503 ms)
- 8 workers: 164.343266 tps (latency: 48.665579 ms)
One more thing is that syslog might drop some log lines, or so I've heard.
Since all tests take the same time, total duration should be similar.
In csvlog case, total duration of all logged queries was 11,627.987 seconds.
In syslog case – only 10,395.516. That's ~ 11% less.
Anyway. Now to the final test. Remote syslog.
First, on db server, I changed (Again) the /etc/rsyslog.d/50-default.conf file:
#local0.*        /var/tmp/postgres.log
local0.*        @172.28.173.1
(172.28.173.1 is the ip of log server).
Now. On the log server, I have syslog-ng installed, with config:
@version: 3.3
@include "scl.conf"

# Syslog-ng configuration file, compatible with default Debian syslogd
# installation.

# First, set some global options.
options { chain_hostnames(off); flush_lines(0); use_dns(no); use_fqdn(no);
          owner("root"); group("adm"); perm(0640); stats_freq(0);
          bad_hostname("^gconfd$"); create_dirs(yes);
};

########################
# Sources
########################
# This is the default behavior of sysklogd package
# Logs may come from unix stream, but not from another machine.
#
source s_src {
       system();
       internal();
};

destination system { file("/var/log/syslog/$YEAR-$MONTH-$DAY/system/$FACILITY.log"); };
log { source(s_src); destination(system); };
so in the s_src section, after “internal();" I added new line:
udp();
And that's all.
Couple of restarts, and the test. Results:
- 1 worker: 145.792663 tps (latency: 6.850254 ms)
- 4 workers: 164.676406 tps (latency: 24.280389 ms)
- 8 workers: 172.701898 tps (latency: 46.711639 ms)
Let's wrap the numbers in a graph format:
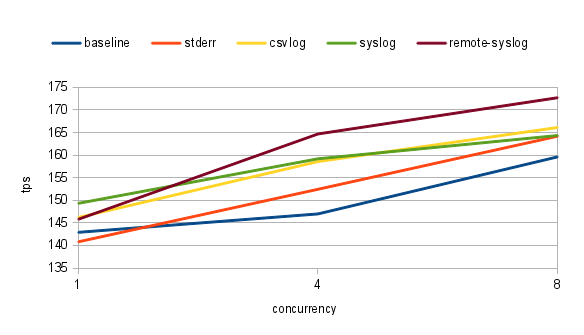
To be honest, the results are quite not spectacular, but they are (at least for me) quite unexpected.
I always thought that writing logs to local file, by pg itself, will be cheapest – if only because there is the smallest amount of work – just write to file, done.
And clearly I was wrong. Based on the data it looks that remote syslog is fastest. Of course – differences are pretty minuscule.
It could be related to the fact that I generated only ~ 200kB of logs per second, which is a far cry from what I've seen on some production databases, but still – it looks like syslog got significantly better from the moment I last tested it (long time ago, many years).
If there is something to be learned from here: I shouldn't assume anything based on old data. And, using centralized logserver using syslog is viable option. If it only would be configured by default to use millisecond precision timestamps…
UPDATE
Based on comments from Greg and Misha, I redid the tests.
This time I:
- used much smaller scale 200 (database is 2997MB, which is well within
limits of what can be cached in memory - used prepared queries, using -M prepared
Results (logged is number of queries logged):
| test: | 1 thread | 4 threads | 8 threads | logged: | ||||
|---|---|---|---|---|---|---|---|---|
| tps | latency | tps | latency | tps | latency | |||
| baseline | 5836.255782 | 0.165391 | 23583.174056 | 0.162684 | 57390.149029 | 0.134150 | 0 | |
| stderr | 4800.454728 | 0.201865 | 31978.609844 | 0.120551 | 48523.682677 | 0.159566 | 74040209 | |
| csvlog | 4817.617233 | 0.201162 | 31298.471743 | 0.123280 | 47151.244997 | 0.164370 | 74158326 | |
| syslog | 4829.737144 | 0.200529 | 31645.829444 | 0.121924 | 47683.654548 | 0.162490 | 394561 | |
| remote-syslog | 5041.920666 | 0.191886 | 31662.549237 | 0.121897 | 47822.122371 | 0.162015 | 398045 | |
Graph looks like this:
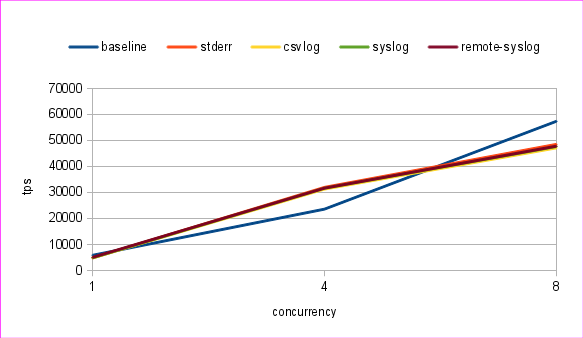
The drop for baseline with 4 threads is not understandable for me. But I did repeat the test and saw the same thing. No idea why.
Anyway. It looks that performance in all of the cases is similar, but syslog logs just a fraction of queries – ~0.5%!
You should use a much smaller database scale, so that the whole database fits in the CPUs L2 cache. With scale=2000, you’re testing seek times more than anything else. Use scale=100 instead, and you should see around 5000 SELECTs/sec/client, and there the logging overhead is a easier to measure.
pg_test_timing is also useful here, to see how much overhead the timing takes on your server. That’s one component to the logging overhead.
Good point. Will redo the test with smaller scale, tomorrow.
The real problem is that logging causes additional I/O that can interact badly with other I/O already happening.
The reason that logging to a separate process is often better is twofold. One one hand it can reduce the amount of separate log streams that go to disk thus optimizing for sequential I/O. On the other hand it introduces a buffer between your process and the I/O to disk.
Something like the journal from systemd is a good example of this. It compresses and stores all logging for the whole system in only a few files. This way it minimizes the I/O and seeks while writing (and reading). I’ve heard that you can also configure rsyslog this way, but I’ve never checked.
Remote logging is often best, purely because you offload the entire I/O. If you perform remote syslog over UDP your logs are at risk, but using TCP should be safe.
Also your log target can block, but each layer adds an additional buffer, which helps as long as the buffers aren’t full (though your logging data is obviously at risk and there is more delay before it’s available).
depesz, try to use prepared plans. i had seen dramatically performance degradation with syslog in this case. Now i use logging_collector and log_directory in tmpfs.
@Misha: will add it to tomorrows tests.
@misha: Did your syslog write to tmpfs too? Otherwise that’s probably your variable.
For normal file I/O (non-tmpfs) syslog should almost always perform better. It only degrades when the syslog daemon is unable to keep it’s buffer from filling up (probably because the storage is blocking) and the in-kernel syslog buffer is too small.
But “direct writes to tmpfs” do trump “via syslog to tmpfs”, but only because you save on a few context switches, some memory copies and some code execution. But all your logs will be at risk (that might be acceptable, but often remote syslog is a better compromise in that case).
I confirm Greg Smith comments about the DB size and impact on speed. Given the size of your test you should maybe wait for about 2 hours to see stable TPS… I did a post about warmup times:
http://blog.coelho.net/database/2013/08/14/postgresql-warmup/
@depesz,
you are right. i had got context switches stick. it was with syslog => remote syslog. there is some feature in pg logging system: when we turn main load to prepared plans then trafic into log became significantly higher against case of plain sql. i do not exactly remember what there is goin on. But i didn’t begin investigate syslog specifics.
We use log_destination = ‘syslog, csvlog’. Can you test more destination?
thanks
If you initialize a small database and then immediately run a select-only test, there’s no need for any sort of warmup. I can get accurate benchmarks from that in less than 10 seconds.
These numbers look right to me now. If you’re running something that manages tens of thousands of TPS, it’s easy to see a 15 to 20% logging overhead. But very few things actually generate that much logging data, so the real overhead is normally a percent or two. Well worth paying that in most cases. The main time I have to turn down logging because it’s too expensive is when multi-line SQL is being run very fast. Systems like that are what I like having the new 9.2 pg_stat_statements to analyze instead of query logs.