i recently got new toy for tests – brand new dell powervault md1000.
what's this, you ask? basically – a rather nice das (direct attached storage) from dell.
the box i got had 15 sas discs, each disc being 72gb, 15krpm.
since this will be used as database storage, i wanted to make some performance tests.
the box was connected to a nice server, i had handy (also dell), specs:
- 4, dual core, xeon processors (3.4ghz)
- 32gb ram
- 2 internal, 15k rpm, 72g, sas discs for system in raid1 setup
for making tests we used bonnie++. test procedure was quite simple:
- setup new raid
- mke2fs -j (ext3)
- mount using noatime and nodiratime options
- run bonnie using these parameters: “-u nobody:nobody -f -s 65000,8192 -n 0 -x 3" (8192 because this is page size in postgresql)
- results (-x 3!) were averaged
i knew we will be going for raid10, so this is what we tested at first.
2 separate series of tests were made:
- raid 10, purely hardware, using 2, 4, 6, 8, 10, 12, and 14 discs
- raid 10, mixed software/hardware – hardware was used to built 7 separate logical devices, each using 2 discs in raid1, then we combined them in software linux raid0 to create 4, 6, 8, 10, 12 and 14 discs raid10 setups
(all tests were done using no read ahead, and write-back using controller's battery backed up memory).
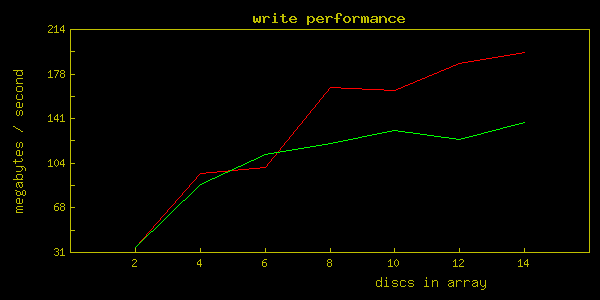
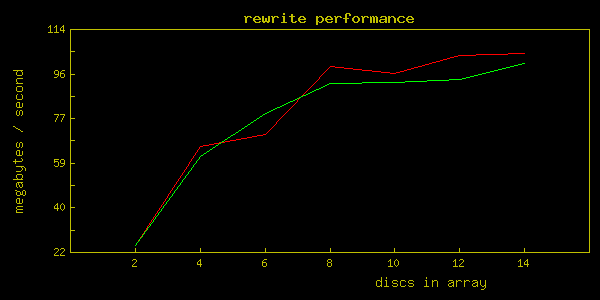
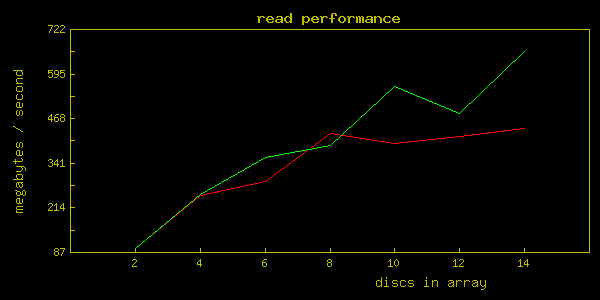
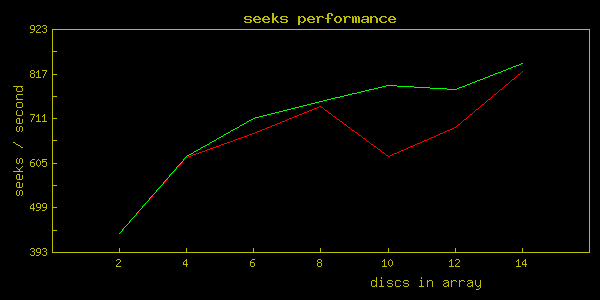
results are somewhat strange (red line – pure hardware, green line – hardware/software):
if you want the results as table:
| name | put_block | put_block_cpu | rewrite | rewrite_cpu | get_block | get_block_cpu | seeks | seeks_cpu |
|---|---|---|---|---|---|---|---|---|
| 2xraid1 | 34820 | 12 | 25105 | 6 | 97459 | 9 | 436 | 1 |
| 4xraid10 | 95427 | 37 | 65661 | 19 | 246490 | 23 | 615 | 1 |
| 6xraid10 | 100367 | 39 | 70955 | 20 | 288188 | 27 | 672 | 1 |
| 8xraid10 | 165980 | 66 | 98887 | 29 | 423983 | 39 | 737 | 1 |
| 10xraid10 | 164195 | 64 | 96039 | 28 | 394442 | 36 | 618 | 1 |
| 12xraid10 | 185671 | 72 | 103271 | 30 | 414942 | 38 | 686 | 1 |
| 14xraid10 | 195349 | 76 | 104087 | 30 | 439088 | 40 | 821 | 2 |
| 2s0@2h1 | 86651 | 32 | 61836 | 18 | 251109 | 24 | 618 | 1 |
| 3s0@2h1 | 110977 | 42 | 79381 | 24 | 356231 | 34 | 708 | 2 |
| 4s0@2h1 | 120232 | 45 | 91988 | 28 | 391041 | 37 | 748 | 2 |
| 5s0@2h1 | 131024 | 50 | 92403 | 28 | 556601 | 55 | 788 | 2 |
| 6s0@2h1 | 123812 | 47 | 93563 | 28 | 482090 | 47 | 778 | 2 |
| 7s0@2h1 | 137513 | 53 | 100083 | 31 | 657221 | 65 | 839 | 2 |
| 2s0@6h10 | 160090 | 61 | 104375 | 32 | 482106 | 46 | 716 | 2 |
| 2s1@2h1 | 44373 | 16 | 25972 | 6 | 99071 | 10 | 651 | 1 |
| 13xraid5 | 222225 | 87 | 113040 | 32 | 392238 | 36 | 806 | 2 |
| 14xraid5 | 222690 | 87 | 114142 | 33 | 398201 | 36 | 809 | 2 |
name column means:
- (\d+)xraid(\d+) – $1 discs in pure hardware raid $2. for example – 6xraid10 means 6 discs in pure hardware raid10
- (\d+)s0@2h1 – $1 logical drives (where each logical drive is 2 discs in hardware raid1) connected using software raid0. for example 5s0@2h1 – 5 logical drives (each of 2 discs in raid1) connected giving in total raid10 over 10 discs in mixed hardware/software setting
- 2s0@6h10 – 2 logical drives, each being 6-disk, hardware raid 10, connected using software raid 0
- 2s1@2h1 – 2 logical drives, each being 2-disk, hardware raid 1, connected using software raid 1 – effectively giving size of 1 disc but using 4 drives
as you can see we tested more than i showed in graphs above, but the rest of tests were only for “fun" of testing :).
strange thing – purely hardware raid has very visible “steps" in write/rewrite performance. speed was gained only when total number of used discs was power of 2. i don't know why, but this is how it worked. in mixed software/hardware raid – there was no such situation.
since we have 15 discs, we decided to use layout of:
- 1 disc for global hot-spare
- 2 disc raid1 (hardware) for pg_xlog
- 8 disc raid10 (hardware) for primary tablespace
- 4 disc raid10 (hardware) for secondary tablespace
theoretically this layout should give best results.
after creation of the arrays and mkfs i decided to make a concurrent test of all 3 arrays at the same time.
i will not graph the results as this is not the point, but numbers from the results are:
| name | put_block | put_block_cpu | rewrite | rewrite_cpu | get_block | get_block_cpu | seeks | seeks_cpu |
|---|---|---|---|---|---|---|---|---|
| 2xraid1 | 30875 | 12 | 15438 | 5 | 39867 | 5 | 224 | 1 |
| 2xraid1 | 32489 | 14 | 24037 | 7 | 99700 | 9 | 389 | 1 |
| 2xraid1 | 35096 | 13 | 24708 | 6 | 96969 | 9 | 383 | 0 |
| 4xraid10 | 41343 | 18 | 31910 | 11 | 61798 | 8 | 109 | 0 |
| 4xraid10 | 80630 | 34 | 35707 | 12 | 137488 | 18 | 306 | 1 |
| 4xraid10 | 40136 | 17 | 38388 | 12 | 147282 | 16 | 255 | 0 |
| 8xraid10 | 42376 | 18 | 37513 | 13 | 155740 | 19 | 302 | 1 |
| 8xraid10 | 156044 | 65 | 34153 | 11 | 177690 | 22 | 338 | 1 |
| 8xraid10 | 146096 | 61 | 71307 | 25 | 29568 | 3 | 154 | 0 |
(i show here all 3 results for each array for comparison purposes).
as you can see the numbers are lower than expected. it has to be noted that 8xraid10 disc finished tests as first, 4xraid10 as second and 2xraid1 as last.
in general i think that the layout we've chosen is the best possible on this array, but i can't help wondering why is this controller so performance-bound to powers of 2.
hope you'll find the numbers useful for your own purposes.
I think you have the wrong units on your graph, you can’t tell me that you can get 722 GB/sec performance out of this beast. I’d venture to say you are off by 1 Si unit.
@Darcy Buskermolen:
heh, of course you are right. fixed the png’s 🙂
What surprise me most is the performance of the software raid / hardware mirror.
I tought that it would always be slower.
Does somebody have a benchmark comparing software-only raid V.S. hardware in a Postgresql context ?
Here are some more results comparing different ways to do 10 disk array with two controllers. Something is up with your seeks, seems low to me. (i was able to get 1500 seeks w/10 disks).
merlin
@Merlin:
your results are better. do you have any idea on what might be wrong?
did you use readahead? what was stripe size?