Starting new blog series – explanation of various configuration parameters.
I will of course follow no schedule or order – if I'd had to – it would be my job, and in this way – it's fun.
First configuration parameter to write about is checkpoint_completion_target.
First, let's think about what checkpoint is.
As you perhaps know PostgreSQL keeps cache of pages (8kB (by default) disk blocks) in RAM. To make it available to all backends, it's stored in shared_buffers, and it's (usually) taking most of the shared_buffers.
Whenever Pg needs to do anything with given page, it checks if it is in shared_buffers, and if not – it loads it (doing some logic to make sure it will not exceed size of shared_buffers by adding new page).
This also happens on writes.
Whenever you write anything (think: insert, update, delete) the change is not written to table. Instead it is written to these pages in memory.
Now of course is a question – what happens if there will be server crash? Since the data is in ram will I lose it? No. Because data is also written to “WAL". WAL are those 16MB files in pg_xlog directory. These are (virtually) never read, and just contain list of changes to pages.
So, the flow looks like this: you issue insert. PostgreSQL loads page to memory (if it wasn't there earlier), modifies it, and writes information about the modification to WAL. The change is not applied to real table files.
Now – after some time – there is a lot of modified pages in memory, that are not applied to table. And this is when CHECKPOINT happens. There is some logic when checkpoint is issued (I will write about it in some later blogpost), but for now, the important part is: when checkpoint happens, all modified (so called dirty) pages are written to actual table and index files.
So far so good? Hope so.
Now – size of checkpoint is of course variable, but depends on size of shared_buffers, and how often you have checkpoints, and how write-intensive your application is.
Let's imagine, that you have server with 100GB of shared_buffers (that's a lot, but not unheard-of). And it's write intensive. So, when checkpoint happens, it could need to “dump" 100GB of data to disk. More or less at once. That's a problem. Because this is huge spike in I/O, and will definitely influence concurrent performance of normal queries.
This is where checkpoint_completion_target shows.
Generally it is a parameter that makes PostgreSQL try to write the data slower – to finish in checkpoint_completion_target * checkpoint_timeout time. Usually you have checkpoint_timeout set to 5 minutes (unless you modified it), and default checkpoint_completion_target is 0.5. This means that PostgreSQL will try to make the checkpoint take 2.5 minutes – to make I/O load lower.
Let's come back to our example. We have 100GB of data to be written to files. And my disk can sustain 1GB per second of writes (that's big server with great I/O). When doing normal checkpoint (the way it was before 8.3), it would cause 100 seconds to 100% utilization of bandwidth to write the data.
But – with checkpoint_completion_target set to 0.5 – PostgreSQL will try to write the data in 2.5 minutes – thus effectively using only ~ 700MB/s of bandwidth, and leaving 30% of I/O capacity for other tasks. That's huge benefit.
The problem with this approach is relatively simple – since checkpoint take longer to write, old, obsolete wal segments stay longer in pg_xlog directory, which will grow larger.
At the time of 8.2, number of files in pg_xlog directory was usually going up to 2 * checkpoint_segments + 1.
Now, it can be estimated to be ( 2 + checkpoint_completion_target ) * checkpoint_segments + 1.
If you read above paragraphs with attention to detail you saw that I used word “try". Reason is very simple – effective I/O bandwidth is variable, so there are no guarantees. So, let's see how it really works.
For tests, I use my test machine, with setup that puts data, xlogs and query logs (useful to test for locks/slowdowns) on separate partitions.
While putting these on separate partitions of the same disk will not increase performance, it will let me accurately monitor what happens on each of the partitions while testing.
With these 3 partitions, I arranged them so:
- sda1 – swap, shouldn't be used, so it's not important
- sda2 – root filesystem, and place where query and iostat logs are stored
- sda3 – $PGDATA
- sda4 – pg_xlog – wal segments
To test Pg, I'm using standard pgbench program, with scale 35 (-s 35, which means that the generated database, without any tests done, is ~ 550MB).
I could have used larger database, but since pgbench writes all-over the database, I want to make sure the writes to tables happen only due to checkpoints, and not because some shared_buffer has to be freed to make place for another.
Since my HDD sustains ~ 50MB/s of writes, I can assume that the checkpoint with checkpoint_completion_target = 0 should take ~ 11 seconds.
Used configuration:
- shared_buffers = 1024MB – I need large shared buffers to be able to observe checkpoint times
- log_checkpoints = on – well, I need to know when checkpoints happen
- checkpoint_segments = 30 – just a number of how many WAL segment can be filled before checkpoint will be forced
- checkpoint_timeout = 5min – how often to checkpoint data
- checkpoint_warning = 5min – if checkpoint happens more often than this (which is the same as timeout) – warn about it in logs. This is to see situation when we have too few checkpoint_segments
- log_line_prefix = ‘%m %r %u %d %p ‘ – to have pg query logs nicely prefixed with important information
- log_min_duration_statement = 5 – I don't want to log all queries – as there will be many of them. I just want to log these over 5ms – so I will see if there will be spikes of number of such queries on checkpoints
I did 5 tests, with checkpoint_completion_target being: 0, 0.3, 0.6, 0.9 and 1.
This is IO utilization of PGDATA partition with checkpoint_completion_target = 0:
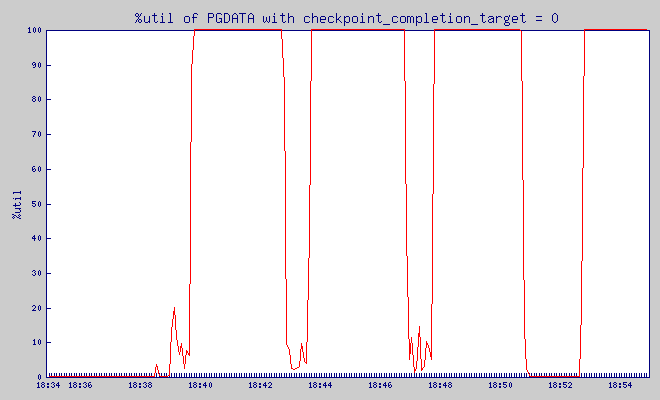
What is %util? From man iostat:
Percentage of CPU time during which I/O requests were issued to the device (bandwidth utilization for the device). Device saturation occurs when this value is close to 100%.
And, based on the graph above, I immediately saw that my test dataset is too large, as the checkpoint took most of the time.
So, I re-did the test, with even smaller dataset – scale 15, size of database – ~ 300MB).
Results
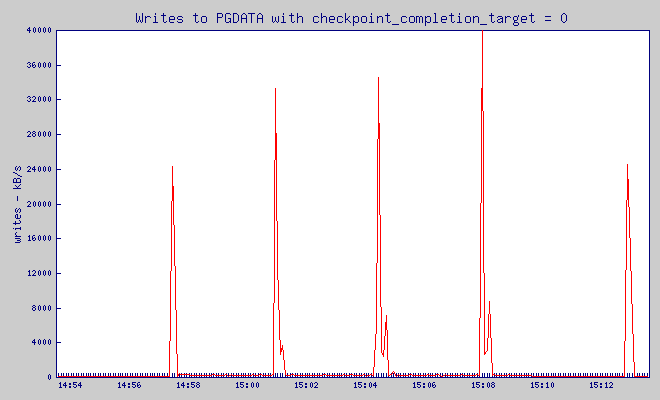
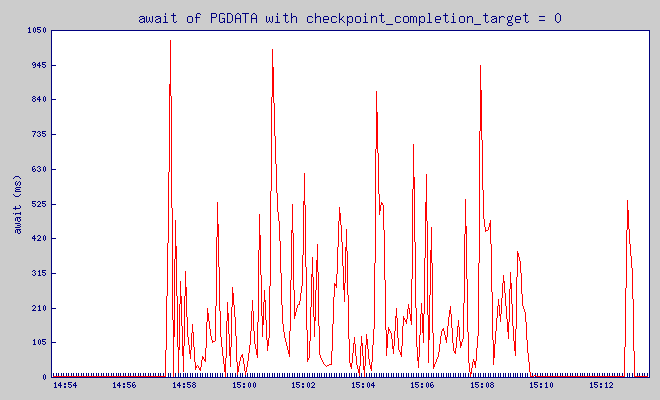
checkpoint_completion_target = 0
Pgbench was putting load on the database between 14:57:34 and 15:09:34. Before it, for 5 minutes – server was not doing anything.
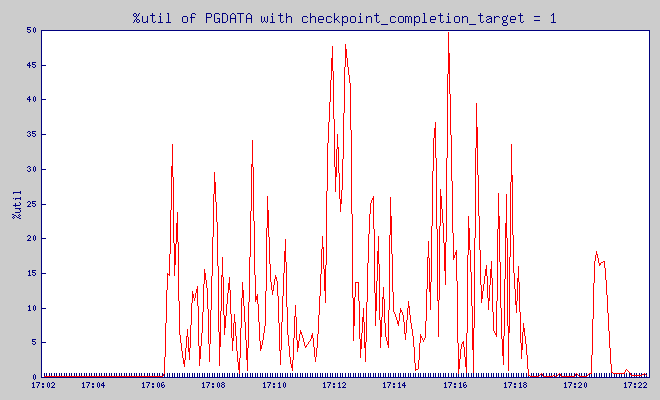
This is IO utilization of PGDATA partition:
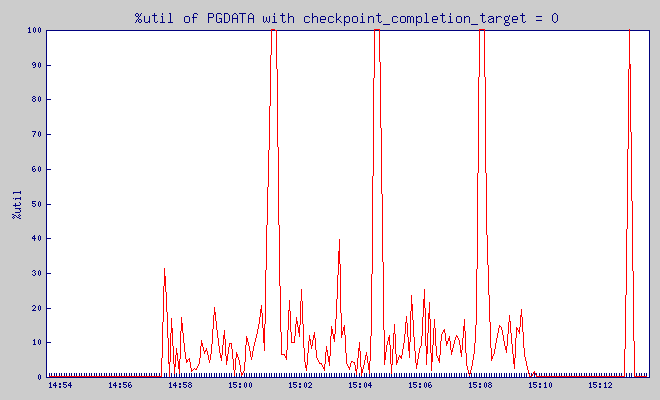
What is %util? From man iostat:
Percentage of CPU time during which I/O requests were issued to the device (bandwidth utilization for the device). Device saturation occurs when this value is close to 100%.
Write throughput:
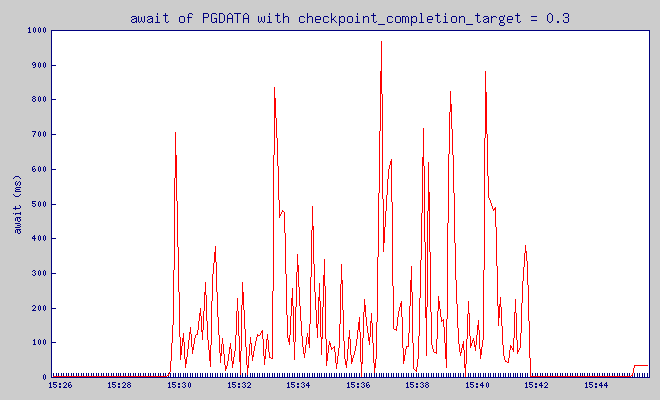
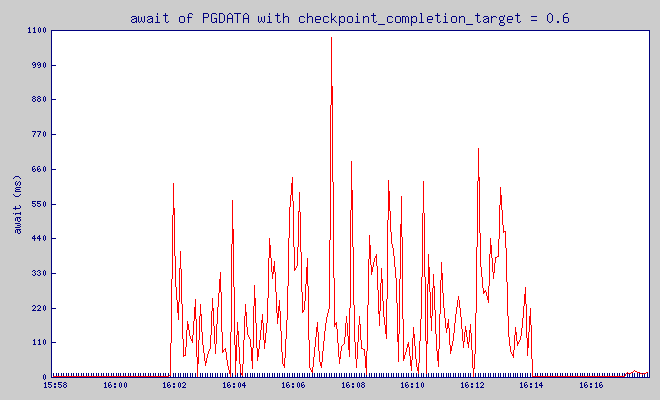
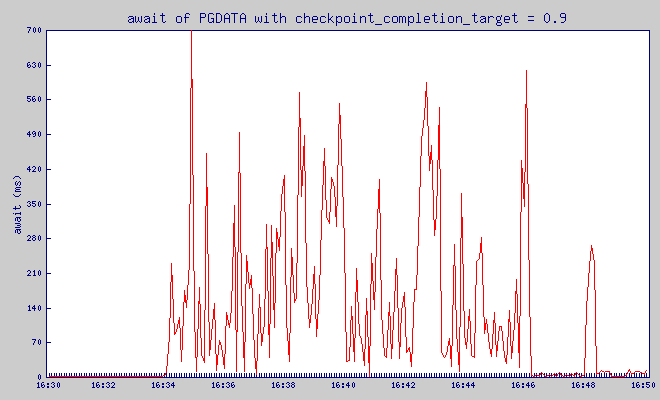
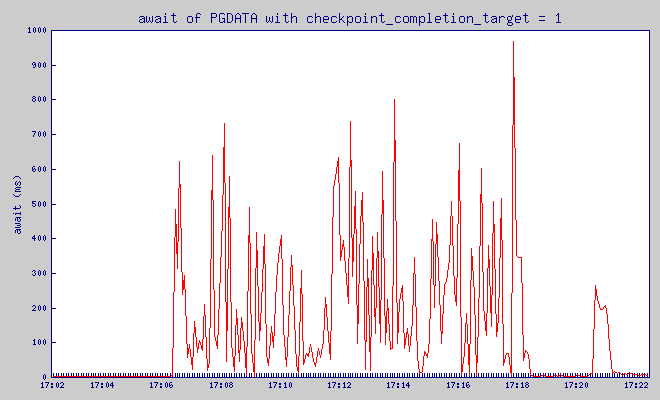
and finally, very important value – await:
The average time (in milliseconds) for I/O requests issued to the device to be served. This includes the time spent by the requests in queue and the time spent servicing them.
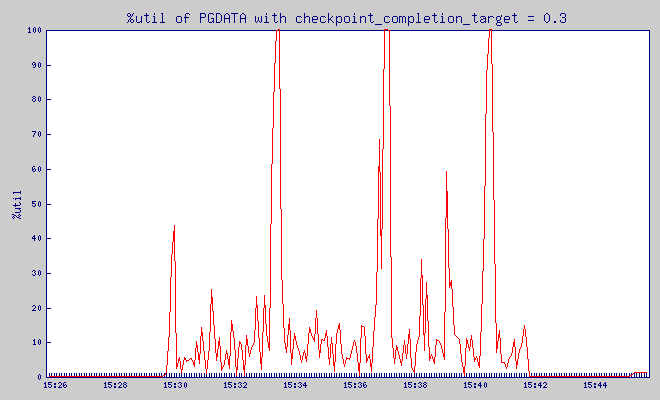
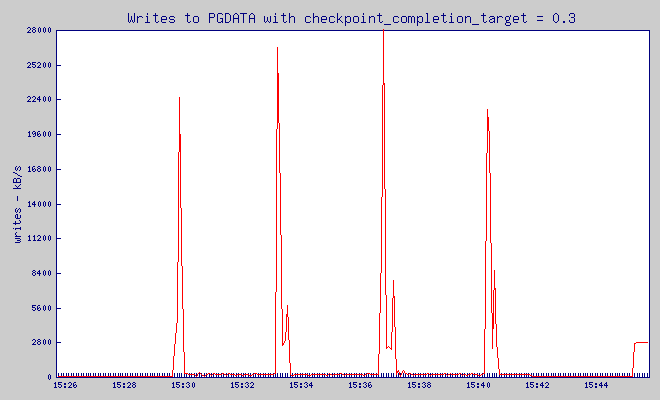
checkpoint_completion_target = 0.3
Pgbench was putting load on the database between 15:29:44 and 15:41:44. Before it, for 5 minutes – server was not doing anything.
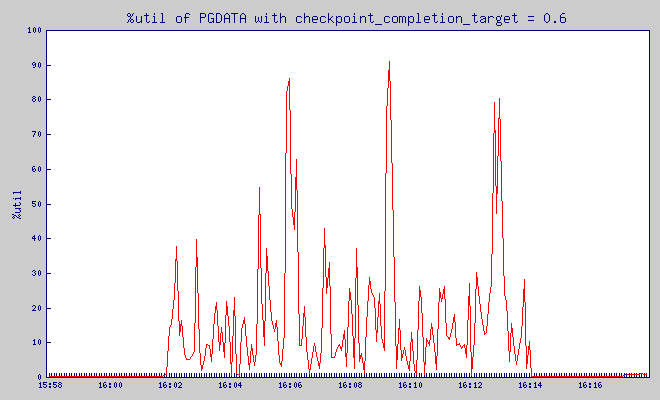
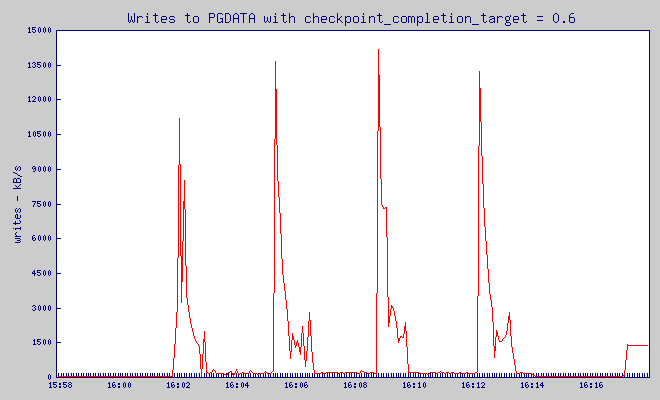
checkpoint_completion_target = 0.6
Pgbench was putting load on the database between 16:01:55 and 16:13:55. Before it, for 5 minutes – server was not doing anything.
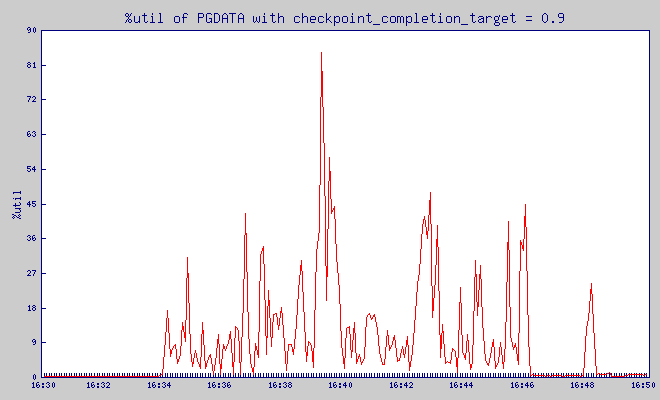
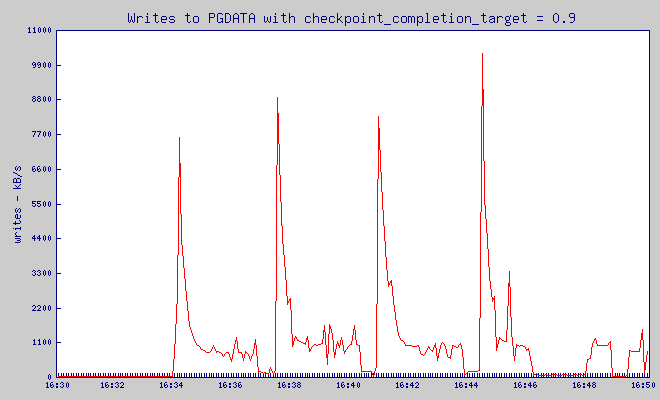
checkpoint_completion_target = 0.9
Pgbench was putting load on the database between 16:34:08 and 16:46:08. Before it, for 5 minutes – server was not doing anything.
checkpoint_completion_target = 1
Pgbench was putting load on the database between 17:06:21 and 17:18:22. Before it, for 5 minutes – server was not doing anything.
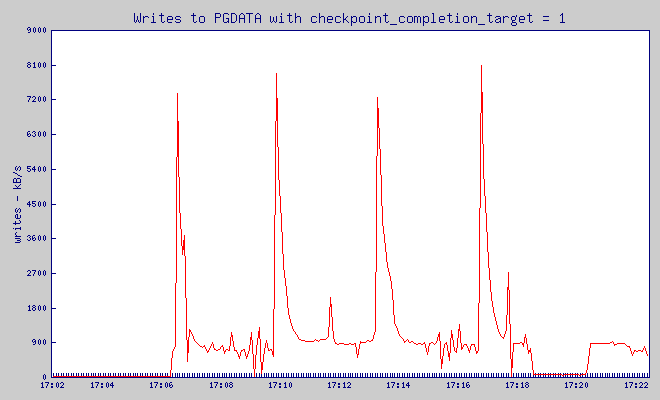
These are graph are pretty jagged, but I hope you can see that while checkpoint_completion_target wrote in one big spike that used 40MB of write traffic, with all the other values of checkpoint_completion_target write spike was much lower.
And how is it relating to number of slow queries? As you perhaps remember – I log every query that took over 5ms. Based on the query log, I can see how often we had slow queries.
| cct | number of queries running more than | ||||
|---|---|---|---|---|---|
| 100ms | 200ms | 300ms | 400ms | 500ms | |
| 0 | 122 | 52 | 51 | 44 | 37 |
| 0.3 | 92 | 41 | 37 | 36 | 31 |
| 0.6 | 122 | 34 | 29 | 28 | 23 |
| 0.9 | 164 | 30 | 18 | 17 | 16 |
| 1 | 173 | 23 | 13 | 13 | 12 |
As you can see increasing checkpoint_completion_target gives visible decrease in number of queries that took over 200ms. Range (100,200)ms is different, but we can see that the longer, and more disrupting queries, are much less likely to happen with larger checkpoint_completion_target.
So, is there any drawback to increasing it?
Well, for starters – it can bloat your pg_xlog directory, according to the formula that I brought at the beginning of the post.
And second – it will not always work – if your shared_buffers are too large, and you write to them too much – pg will have to checkpoint virtually all the time – just like what happened in the first graph that I showed, thus any “slowdown" will simply not work.
Finally – remember that the longer the time from last checkpoint, in case of forced shutdown (think: power outage) – the longer will take recovery. And since larger checkpoint_completion_target means slower checkpoints – it also makes you (on average) further away from last checkpoint – thus making eventual recovery longer.
Aside from this facts – I can't really think of any reason not to make it to 0.9 (I wouldn't go with 1.0, to avoid situation when next checkpoint is postponed, due to previous one not being done yet) as a basic change in tuning PostgreSQL.
Thank you for excelent example with checkpoints, now I understand what does it mean!
Thank you Hubert, this was very clarifying.
Hubert,
Thanks for doing this test!
I wouldn’t go changing things to 0.9 on this test alone; you’re testing with a very small database compared to RAM, and only doing small writes to the database, which is a minority case. We’d need some other workload tests … large database, large batch writes, etc.
@Josh:
sure. I mean – it should be monitored in logs, but if the checkpoints have some clear “free” time between finish of one checkpoint and starting of another, it’s good idea to increase checkpoint_completion_target to lower IO usage.
At 0.9, I would be worried that the checkpoint scheduling code might not complete before the next checkpoint — I am unclear how reliable that code is.
Hubert,
I have just one question about this benchmark.
What is the effect of bgwriter on flushing dirty pages in between checkpoints. Should it be disabled for such a benchmark?
Also, each backend may flush out dirty pages if necessary, would be nice to see how frequently that happens.
Thanks,
Teer.
checkpoint_completion_target sets when the write phase of the checkpoint tries to finish. After that, it then executes a sync phase that also takes some time, and the checkpoint isn’t actually over until that is finished, too. On a busy server, the sync phase can take longer than the write one. That’s why the default is 0.5; it leaves some extra time for a slow sync to process, while still not running behind the expected schedule. You can set it to 0.9, and I do that sometimes, but if your sync phase times get too long you can run into trouble with that.
Thanks! Nice explanation.
Hello depesz, excuse me, my english is very bad.
I want to know if postgresql checkpoints prevent current transactions to write the same page being flush to disk by checkpoint proccess.
and I want know if the postgresql checkpoint use the ARIES algorithmo.
thank for your answer.
Att.
richard hinestroza.
@Richard:
no idea, please ask the question in more appropriate place – like pgsql-hackers mailing list.
Hello again.
I have translated this post into Spanish language
http://blogadminsistemas.blogspot.com.es/2016/08/comprender-postgresqlconf.html