Three interesting patches:
- On 27th of March, Robert Haas committed patch:
New GUC, track_iotiming, to track I/O timings.

Currently, the only way to see the numbers this gathers is via
EXPLAIN (ANALYZE, BUFFERS), but the plan is to add visibility through
the stats collector and pg_stat_statements in subsequent patches.

Ants Aasma, reviewed by Greg Smith, with some further changes by me.
- On 27th of March, Robert Haas committed patch:
Expose track_iotiming information via pg_stat_statements.

Ants Aasma, reviewed by Greg Smith, with very minor tweaks by me.
-
On 29th of March, Tom Lane committed patch:
Improve contrib/pg_stat_statements to lump "similar" queries together.

pg_stat_statements now hashes selected fields of the analyzed parse tree
to assign a "fingerprint" to each query, and groups all queries with the
same fingerprint into a single entry in the pg_stat_statements view.
In practice it is expected that queries with the same fingerprint will be
equivalent except for values of literal constants.  To make the display
more useful, such constants are replaced by "?" in the displayed query
strings.

This mechanism currently supports only optimizable queries (SELECT,
INSERT, UPDATE, DELETE).  Utility commands are still matched on the
basis of their literal query strings.

There remain some open questions about how to deal with utility statements
that contain optimizable queries (such as EXPLAIN and SELECT INTO) and how
to deal with expiring speculative hashtable entries that are made to save
the normalized form of a query string.  However, fixing these issues should
require only localized changes, and since there are other open patches
involving contrib/pg_stat_statements, it seems best to go ahead and commit
what we've got.

Peter Geoghegan, reviewed by Daniel Farina
Some time ago I wrote about pg_stat_statements – contrib module which does in-db similar thing to what pgFouine does with logs.
Back then, there were problems with it – namely – it treated “select * from table where field = 1" and “select * from table where field = 2" as two different queries – unless you used prepared statements, but I'm not fan of these.
Now, this new version supposedly fixes this problem, and adds more information – information that is not available in normal logs!
Loading, in 9.2 needs two steps:
- Add line:
shared_preload_libraries = 'pg_stat_statements'
to postgresql.conf
- Restart PostgreSQL to make the library loaded.
- In some database – doesn't matter which one, you have to run:
create extension pg_stat_statements;to have access to the stats
Contrib module, once loaded (in shared_preload_libraries GUC) gets data about all queries in all databases. The extension just puts two helper functions, and a view in the database you created it in.
With all of this loaded, let's see how it really works – first – does it really treat “select * from table where field = 1" and “select * from table where field = 2" as the same query now?
$ select pg_stat_statements_reset();
 pg_stat_statements_reset
──────────────────────────

(1 row)

$ select count(*) from pg_class where relkind = 'r';
 count
───────
    58
(1 row)

$ select count(*) from pg_class where relkind = 'i';
 count
───────
   112
(1 row)

$ select * from pg_stat_statements where query ~ 'from pg_class where relkind';
─[ RECORD 1 ]───────┬─────────────────────────────────────────────────
userid              │ 16384
dbid                │ 16388
query               │ select count(*) from pg_class where relkind = ?;
calls               │ 2
total_time          │ 0.000268
rows                │ 2
shared_blks_hit     │ 16
shared_blks_read    │ 0
shared_blks_dirtied │ 0
shared_blks_written │ 0
local_blks_hit      │ 0
local_blks_read     │ 0
local_blks_dirtied  │ 0
local_blks_written  │ 0
temp_blks_read      │ 0
temp_blks_written   │ 0
time_read           │ 0
time_write          │ 0
Good news, everyone – it works. Both queries were normalized to “select count(*) from pg_class where relkind = ?", and calls count shows correctly 2 calls.
Let's make one more test – is it smart enough to swap columns?
$ select oid, relname from pg_class where relkind = 'r' limit 1;
─[ RECORD 1 ]─────────
oid     │ 2619
relname │ pg_statistic

$ select relname, oid from pg_class where relkind = 'r' limit 1;
─[ RECORD 1 ]─────────
relname │ pg_statistic
oid     │ 2619

$ select count(*) from pg_stat_statements where query ~ 'from pg_class where relkind.*limit';
─[ RECORD 1 ]
count │ 2
No. It's not. But that's OK – so far nothing is (well, my tool is smart enough in some cases.).
It is interesting to see that we have a bunch of additional columns – related to block I/O – we see how many read blocks where found in shared_buffers, how many were dirtied because of the query and so on.
Let's see how it works. I have 32MB of shared_buffers in this test instance, so query to any table that has more than this in size should show interesting values 🙂
$ create table test as select i, repeat('depesz', 10) as filler from generate_series(1,400000) i;
SELECT 400000

$ select * from pg_stat_statements where query ~ 'table test';
─[ RECORD 1 ]───────┬────────────────────────────────────────────────────────────────────────────────────────────────
userid              │ 16384
dbid                │ 16388
query               │ create table test as select i, repeat('depesz', 10) as filler from generate_series(1,400000) i;
calls               │ 1
total_time          │ 1.457536
rows                │ 0
shared_blks_hit     │ 302
shared_blks_read    │ 4939
shared_blks_dirtied │ 4950
shared_blks_written │ 4408
local_blks_hit      │ 0
local_blks_read     │ 0
local_blks_dirtied  │ 0
local_blks_written  │ 0
temp_blks_read      │ 685
temp_blks_written   │ 684
time_read           │ 0
time_write          │ 0
Nice. I'm not entirely sure what are those “local blocks" though, and the documentation is also not clear on it.
Still, let's see how select's on such table work:
$ select count(*) from test;
─[ RECORD 1 ]─
count │ 400000

$ select * from pg_stat_statements where query ~ 'count.*test';
─[ RECORD 1 ]───────┬───────────────────────────
userid              │ 16384
dbid                │ 16388
query               │ select count(*) from test;
calls               │ 1
total_time          │ 0.048413
rows                │ 1
shared_blks_hit     │ 544
shared_blks_read    │ 4395
shared_blks_dirtied │ 0
shared_blks_written │ 0
local_blks_hit      │ 0
local_blks_read     │ 0
local_blks_dirtied  │ 0
local_blks_written  │ 0
temp_blks_read      │ 0
temp_blks_written   │ 0
time_read           │ 0
time_write          │ 0

$ select count(*) from test;
─[ RECORD 1 ]─
count │ 400000

$ select * from pg_stat_statements where query ~ 'count.*test';
─[ RECORD 1 ]───────┬───────────────────────────
userid              │ 16384
dbid                │ 16388
query               │ select count(*) from test;
calls               │ 2
total_time          │ 0.096897
rows                │ 2
shared_blks_hit     │ 1120
shared_blks_read    │ 8758
shared_blks_dirtied │ 0
shared_blks_written │ 0
local_blks_hit      │ 0
local_blks_read     │ 0
local_blks_dirtied  │ 0
local_blks_written  │ 0
temp_blks_read      │ 0
temp_blks_written   │ 0
time_read           │ 0
time_write          │ 0
shared_blks_hit/read are correctly incremented, though it looks like pg has to read much more data than I expected.
The 2 columns at the end – time_read and time_write are empty. To make them contain some data we need to enable “track_iotiming":
$ select pg_stat_statements_reset();
─[ RECORD 1 ]────────────┬─
pg_stat_statements_reset │

$ set track_iotiming = true;
SET

$ drop table test;
DROP TABLE

$ create table test as select i, repeat('depesz', 10) as filler from generate_series(1,400000) i;
SELECT 400000

$ select count(*) from test;
─[ RECORD 1 ]─
count │ 400000

$ select query, calls, time_read, time_write from pg_stat_statements;
─[ RECORD 1 ]───────────────────────────────────────────────────────────────────────────────────────────────
query      │ drop table test;
calls      │ 1
time_read  │ 0
time_write │ 0
─[ RECORD 2 ]───────────────────────────────────────────────────────────────────────────────────────────────
query      │ create table test as select i, repeat('depesz', 10) as filler from generate_series(1,400000) i;
calls      │ 1
time_read  │ 0
time_write │ 0.319568
─[ RECORD 3 ]───────────────────────────────────────────────────────────────────────────────────────────────
query      │ select pg_stat_statements_reset();
calls      │ 1
time_read  │ 0
time_write │ 0
─[ RECORD 4 ]───────────────────────────────────────────────────────────────────────────────────────────────
query      │ set track_iotiming = true;
calls      │ 1
time_read  │ 0
time_write │ 0
─[ RECORD 5 ]───────────────────────────────────────────────────────────────────────────────────────────────
query      │ select count(*) from test;
calls      │ 1
time_read  │ 0.007696
time_write │ 0.013145
In here we see some interesting information. First of all – we do see time that create table spent writing information.
But we also see that select count(*) writes data! I think it's because of dirty buffers that had to be written so that count(*) could use them for reading data from disk. This theory seems to be proved by the fact that after checkpoint and resetting stats – count(*) doesn't write anymore:
$ checkpoint;
CHECKPOINT

$ select pg_stat_statements_reset();
 pg_stat_statements_reset
──────────────────────────

(1 row)

$ select count(*) from test;
 count
────────
 400000
(1 row)

$ select query, calls, time_read, time_write from pg_stat_statements;
               query                │ calls │ time_read │ time_write
────────────────────────────────────┼───────┼───────────┼────────────
 select pg_stat_statements_reset(); │     1 │         0 │          0
 select count(*) from test;         │     1 │  0.007603 │          0
(2 rows)
It should be noted, though, that these things are not free – pg_stat_statements does introduce it's overhead, and tracking i/o timing introduces another (possibly higher) overhead. How much overhead it actually is? Let's see.
I wrote a simple script, which:
- created test database
- initialized pgbench database with scale = 20 (~ 320MB of database size, not much, but more than shared_buffers @ 24MB)
- ran a test of pgbench and logged transactions per second count (excluding connection time)
This test was ran for concurrency of 1, 5, 10, 15, 20 and 25. For each concurrency, I ran the test three times, and used average tps from these 3 runs.
All of this was done for:
- default configuration – “base"
- base config, but with pg_stat_statements loaded
- base config with track_iotiming enabled
- base config with both track_iotiming and pg_stat_statements loaded
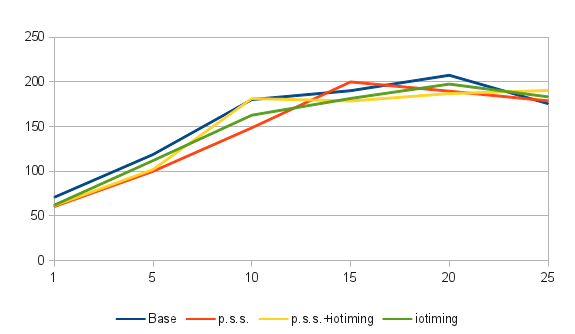
Results are like this:
| Concurrency | 1 | 5 | 10 | 15 | 20 | 25 |
|---|---|---|---|---|---|---|
| base | 70.908 | 118.708 | 180.121 | 190.050 | 207.320 | 175.615 |
| base + p.s.s | 60.486 | 99.921 | 148.548 | 199.900 | 189.496 | 178.722 |
| base + iotiming | 62.161 | 111.923 | 162.692 | 181.376 | 197.459 | 183.211 |
| base + p.s.s + iotiming | 61.641 | 101.936 | 181.319 | 178.514 | 186.824 | 190.334 |
Table might not be very readable, so I have a graph:
I also made one, which shows how much percent of performance you're loosing (or gaining?!) in every case. Base = 100%, which means it doesn't gain or lose anything – so it sits at “0%":
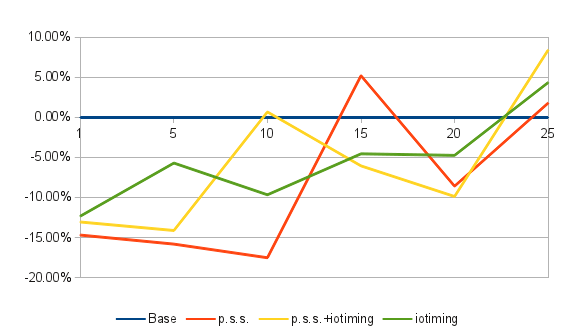
It clearly shows that my results are not really great – value for base with concurrency 25 is lower than with pg_stat_statements and track_iotiming, but this could be simply related to different context switch scenario – this was not a powerful machine – just a core2duo desktop under linux (with most of the daemons disabled, to minimize external influences on pgbench results).
All in all – it shows that in worst case you're losing 15% of performance, and that if you'll decide to enable pg_stat_statements, you can eable track_iotiming too, as its overhead seems to be surprisingly low.
Going back to original subject – both changes are very welcome. We definitely can use this kind of information, and thanks to these new additions – pg_stat_statements looks more and more interesting.
Local blocks are data blocks for temporary tables and indexes. Shared blocks are data blocks for permanent or unlogged tables and indexes.
@Robert:
thanks for clarification.
Not sure but I think writes following the count(*) request may be rather due to hint bits.
why temporary table has write involved, just in case the temporary table is too big for the temp/local buffer to hold?