On 11th of November, Robert Haas committed patch:
Generate parallel sequential scan plans in simple cases.

Add a new flag, consider_parallel, to each RelOptInfo, indicating
whether a plan for that relation could conceivably be run inside of
a parallel worker.  Right now, we're pretty conservative: for example,
it might be possible to defer applying a parallel-restricted qual
in a worker, and later do it in the leader, but right now we just
don't try to parallelize access to that relation.  That's probably
the right decision in most cases, anyway.

Using the new flag, generate parallel sequential scan plans for plain
baserels, meaning that we now have parallel sequential scan in
PostgreSQL.  The logic here is pretty unsophisticated right now: the
costing model probably isn't right in detail, and we can't push joins
beneath Gather nodes, so the number of plans that can actually benefit
from this is pretty limited right now.  Lots more work is needed.
Nevertheless, it seems time to enable this functionality so that all
this code can actually be tested easily by users and developers.

Note that, if you wish to test this functionality, it will be
necessary to set max_parallel_degree to a value greater than the
default of 0.  Once a few more loose ends have been tidied up here, we
might want to consider changing the default value of this GUC, but
I'm leaving it alone for now.

Along the way, fix a bug in cost_gather: the previous coding thought
that a Gather node's transfer overhead should be costed on the basis of
the relation size rather than the number of tuples that actually need
to be passed off to the leader.

Patch by me, reviewed in earlier versions by Amit Kapila.
There have been some blogposts about it already, but since it's important, I figured I'll write about it too 🙂
As you perhaps know, all operations (so far), for given query, were done in sequential way. That is – you could have had index scans, nested loops, and so on, but at any given time, only one of these was working. At most one CPU.
Now, it's changing.
For tests, I made simple table:
$ \d test
        TABLE "public.test"
    COLUMN    |  TYPE  | Modifiers
--------------+--------+-----------
 id           | BIGINT | NOT NULL
 some_integer | BIGINT | NOT NULL
 some_text    | text   | NOT NULL
Indexes:
    "test_pkey" PRIMARY KEY, btree (id)
In there, I loaded some rows:
$ SELECT COUNT(*), pg_size_pretty(pg_table_size('test')) AS table_size FROM test;
  COUNT   | table_size
----------+------------
 20362302 | 2515 MB
(1 ROW)
Now. Getting some stats will obviously be relatively slow:
$ EXPLAIN analyze
SELECT
    COUNT(*),
    MIN(some_integer), avg(some_integer), MAX(some_integer),
    MIN(LENGTH(some_text)), avg(LENGTH(some_text)), MAX(LENGTH(some_text))
FROM test;
                                                        QUERY PLAN
---------------------------------------------------------------------------------------------------------------------------
 Aggregate  (cost=1034544.57..1034544.58 ROWS=1 width=89) (actual TIME=26593.641..26593.641 ROWS=1 loops=1)
   ->  Seq Scan ON test  (cost=0.00..525487.02 ROWS=20362302 width=89) (actual TIME=0.043..3536.170 ROWS=20362302 loops=1)
 Planning TIME: 0.075 ms
 Execution TIME: 26593.721 ms
(4 ROWS)
This is understandable. But now, we have the all-powerful parallel seq scan. But how do I enable it?
It's simple – I just set max_parallel_degree variable to some value larger than 1 (it's 0 by default).
So, let's try:
$ SET max_parallel_degree = 2;
SET

$ EXPLAIN analyze
SELECT
    COUNT(*),
    MIN(some_integer), avg(some_integer), MAX(some_integer),
    MIN(LENGTH(some_text)), avg(LENGTH(some_text)), MAX(LENGTH(some_text))
FROM test;
                                                        QUERY PLAN
---------------------------------------------------------------------------------------------------------------------------
 Aggregate  (cost=1034524.77..1034524.78 ROWS=1 width=89) (actual TIME=26569.188..26569.188 ROWS=1 loops=1)
   ->  Seq Scan ON test  (cost=0.00..525481.36 ROWS=20361736 width=89) (actual TIME=0.043..3541.823 ROWS=20362302 loops=1)
 Planning TIME: 0.082 ms
 Execution TIME: 26569.254 ms
(4 ROWS)
No parallelization? Why is that? That's simple – as of now, the code for parallelization is rather simplistic. It doesn't know how to work with aggregates – it can at most do some filtering, but not grouping or anything else.
OK. So let's search the table for all rows containing string ‘depesz' in some_text (that's unlikely to happen). In new psql session:
$ EXPLAIN analyze SELECT * FROM test WHERE some_text LIKE '%depesz%';
                                                 QUERY PLAN
-------------------------------------------------------------------------------------------------------------
 Seq Scan ON test  (cost=0.00..576385.70 ROWS=2036 width=97) (actual TIME=5390.310..5390.310 ROWS=0 loops=1)
   FILTER: (some_text ~~ '%depesz%'::text)
   ROWS Removed BY FILTER: 20362302
 Planning TIME: 0.420 ms
 Execution TIME: 5390.368 ms
(5 ROWS)
OK, and now let's try with 2 parallel tasks:
$ SET max_parallel_degree = 2;
SET

$ EXPLAIN analyze SELECT * FROM test WHERE some_text LIKE '%depesz%';
                                                         QUERY PLAN
----------------------------------------------------------------------------------------------------------------------------
 Gather  (cost=1000.00..231757.88 ROWS=2036 width=97) (actual TIME=1931.971..1931.971 ROWS=0 loops=1)
   NUMBER OF Workers: 2
   ->  Parallel Seq Scan ON test  (cost=0.00..230554.28 ROWS=2036 width=97) (actual TIME=1927.467..9645.735 ROWS=0 loops=1)
         FILTER: (some_text ~~ '%depesz%'::text)
         ROWS Removed BY FILTER: 33962237
 Planning TIME: 0.100 ms
 Execution TIME: 1932.997 ms
(7 ROWS)
Much better. I ran “ps" in separate window to see how it looks, and this is what I saw:
USER        PID %CPU %MEM    VSZ   RSS TTY      STAT START   TIME COMMAND
pgdba     50941  0.0  0.0 176576 13516 pts/1    S    20:11   0:00 /home/pgdba/WORK/bin/postgres -D /home/pgdba/DATA
pgdba     50945  0.0  0.0  29484   740 ?        Ss   20:11   0:00  \_ postgres: logger process
pgdba     50947  0.0  0.0 176784 42436 ?        Ss   20:11   0:00  \_ postgres: checkpointer process
pgdba     50948  0.0  0.0 176576  2164 ?        Ss   20:11   0:00  \_ postgres: writer process
pgdba     50949  0.0  0.0 176576  5060 ?        Ss   20:11   0:00  \_ postgres: wal writer process
pgdba     50950  0.0  0.0 176996  1968 ?        Ss   20:11   0:00  \_ postgres: autovacuum launcher process
pgdba     50951  0.0  0.0  31576   940 ?        Ss   20:11   0:00  \_ postgres: archiver process   LAST was 0000000100000000000000B0
pgdba     50952  0.0  0.0  31708  1156 ?        Ss   20:11   0:00  \_ postgres: stats collector process
pgdba     56473 15.4  0.0 177688 46568 ?        Rs   20:28   0:21  \_ postgres: depesz depesz [LOCAL] EXPLAIN
pgdba     57217  147  0.0 177560 13160 ?        Rs   20:30   0:01  \_ postgres: bgworker: parallel worker FOR PID 56473
pgdba     57218  146  0.0 177560 13640 ?        Rs   20:30   0:01  \_ postgres: bgworker: parallel worker FOR PID 56473
This is pretty awesome – I have 3 processes running – one that is doing the explain, and two that are parallelizing seq scan. CPU usage was immediately higher too.
That leads to question – and what will happen with max_parallel_degree set to 1? This:
$ SET max_parallel_degree = 1;
SET

$ EXPLAIN analyze SELECT * FROM test WHERE some_text LIKE '%depesz%';
                                                         QUERY PLAN
----------------------------------------------------------------------------------------------------------------------------
 Gather  (cost=1000.00..385460.73 ROWS=2036 width=97) (actual TIME=2743.160..2743.160 ROWS=0 loops=1)
   NUMBER OF Workers: 1
   ->  Parallel Seq Scan ON test  (cost=0.00..384257.13 ROWS=2036 width=97) (actual TIME=2740.837..8224.571 ROWS=0 loops=1)
         FILTER: (some_text ~~ '%depesz%'::text)
         ROWS Removed BY FILTER: 30518183
 Planning TIME: 0.091 ms
 Execution TIME: 2744.125 ms
(7 ROWS)
Interestingly – it was still faster than “normal" seq scan, but I assume it's due to caching.
Process tree, during this test, looked like:
USER        PID %CPU %MEM    VSZ   RSS TTY      STAT START   TIME COMMAND
pgdba     50941  0.0  0.0 176576 13516 pts/1    S    20:11   0:00 /home/pgdba/WORK/bin/postgres -D /home/pgdba/DATA
pgdba     50945  0.0  0.0  29484   740 ?        Ss   20:11   0:00  \_ postgres: logger process
pgdba     50947  0.0  0.0 176784 42436 ?        Ss   20:11   0:00  \_ postgres: checkpointer process
pgdba     50948  0.0  0.0 176576  2164 ?        Ss   20:11   0:00  \_ postgres: writer process
pgdba     50949  0.0  0.0 176576  5060 ?        Ss   20:11   0:00  \_ postgres: wal writer process
pgdba     50950  0.0  0.0 176996  1968 ?        Ss   20:11   0:00  \_ postgres: autovacuum launcher process
pgdba     50951  0.0  0.0  31576   940 ?        Ss   20:11   0:00  \_ postgres: archiver process   LAST was 0000000100000000000000B0
pgdba     50952  0.0  0.0  31708  1156 ?        Ss   20:11   0:00  \_ postgres: stats collector process
pgdba     56473  9.9  0.0 177608 47216 ?        Rs   20:28   0:24  \_ postgres: depesz depesz [LOCAL] EXPLAIN
pgdba     57795 85.0  0.0 177480 17504 ?        Rs   20:32   0:02  \_ postgres: bgworker: parallel worker FOR PID 56473
OK. So, it's faster. Let's see how much faster. I did test, the same query, five times with max_parallel_degree set to every integer from 0 to 40 (there are 32 cores visible in this server). Out of each 5 runs, I took best time. Results:
| max_parallel_degree: | best time: |
|---|---|
| 0 | 5389.325 ms |
| 1 | 2858.865 ms |
| 2 | 1902.733 ms |
| 3 | 1431.939 ms |
| 4 | 1146.308 ms |
| 5 | 942.612 ms |
| 6 | 817.514 ms |
| 7 | 827.014 ms |
| 8 | 824.099 ms |
| 9 | 812.373 ms |
| 10 | 820.753 ms |
| 11 | 830.708 ms |
| 12 | 829.946 ms |
| 13 | 830.185 ms |
| 14 | 819.024 ms |
| 15 | 810.251 ms |
| 16 | 810.904 ms |
| 17 | 827.195 ms |
| 18 | 813.992 ms |
| 19 | 807.717 ms |
| 20 | 808.777 ms |
| 21 | 811.371 ms |
| 22 | 821.320 ms |
| 23 | 813.609 ms |
| 24 | 838.325 ms |
| 25 | 809.690 ms |
| 26 | 828.281 ms |
| 27 | 821.077 ms |
| 28 | 809.640 ms |
| 29 | 808.974 ms |
| 30 | 816.738 ms |
| 31 | 811.953 ms |
| 32 | 815.192 ms |
| 33 | 818.727 ms |
| 34 | 819.273 ms |
| 35 | 813.762 ms |
| 36 | 813.077 ms |
| 37 | 810.124 ms |
| 38 | 811.913 ms |
| 39 | 821.604 ms |
| 40 | 814.455 ms |
Or, in more graphic way:
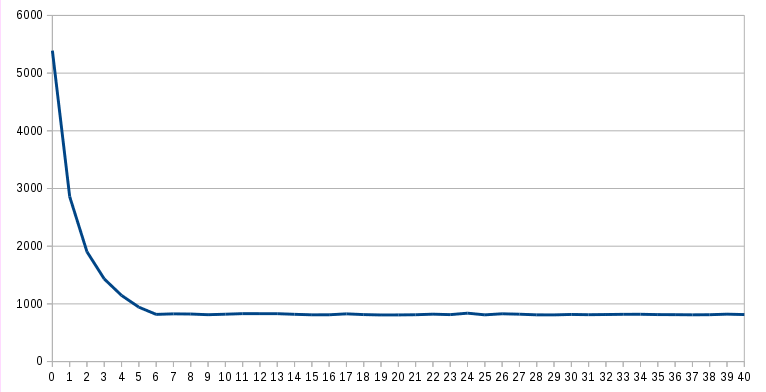
Now, it looks that I was wrong – max_parallel_degree = 1 is actually doing the scan in parallel – it would suggest that actual number of parallel tasks is (max_parallel_degree + 1), which kinda makes sense.
Also, at least on my test table, on my test server, there is no real benefit from going over max_parallel_degree = 6.
In any way – it's clearly great news. Now that the whole “infrastructure" for operation parallelization is in place, we can get our hopes for smarter parallelization (as in: handle aggregates when possible), and parallelizing other operations than just seq scans – for example – Foreign Scans, so we'd get actual sharding.
This makes me very happy, and I'd like to express my gratitude towards all involved in development, tests, and fixes. Great job.
I want to known your test data,
and the method for generating data .
Please!
Because when I tested parallel sequential scan according to your method, test results are not very satisfactory.
So,let me known your method for generating test data.
@puqun:
just some random values.
like select random(), ‘sss’||i from generate_series(1,10) i;
Big big thanks to all postgres’s developpers !!!
That’s a huge progress. Oracle’s end is close.
Greetings for you all